A New Visualization Tool for TaskVine Released
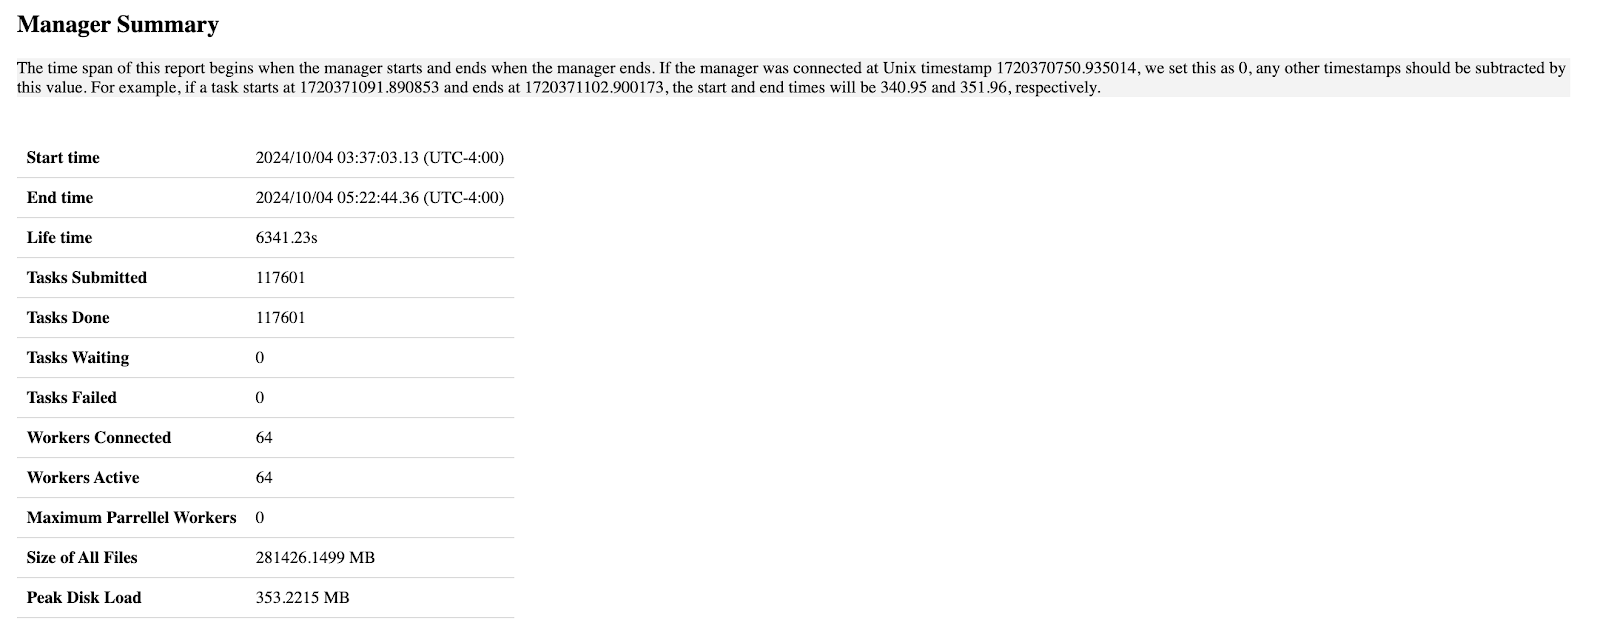
We released a web-based tool to visualize runtime logs produced by TaskVine, available on Github . Using this tool involves two main steps. First, the required data in CSV format must be generated for the manager, workers, tasks, and input/output files. After saving the generated data in the directory, users can start a port on their workstation to view detailed information about the run. This approach offers two key advantages: the generated data can be reused multiple times, minimizing the overhead of regeneration, and users can also develop custom code to analyze the structured data and extract relevant insights. For example, the first section describes the general information of this run, including the start/end time of the manager, how many tasks are submitted, how many of them succeeded or failed, etc. The second section describes the manager's storage usage through its lifetime, the a-axis starts from when the manager is started, and ends when the manager is terminated, the ...